Market sentiment is increasingly tinged with caution as investors begin to tread carefully. Concerns about potential volatility and economic factors are influencing trading behaviors and decisions, highlighting the need for vigilance moving forward.
Indian Stock Market Outlook: A Remarkable Rally in 2024
The Indian stock market has experienced a remarkable surge in 2024, with key benchmarks like the Nifty50 witnessing an impressive increase of over 20% at its peak. Presently, the Nifty50 index hovers around 25,000, indicating a notable gain of approximately 15% year-to-date.
Sector Rotation Driving Growth
This upward movement in the market can be attributed to a dynamic rotation among sectors and market segments. Investors are shifting their focus from large-cap stocks to mid-cap and small-cap stocks, which helps sustain overall market enthusiasm and keeps broader indices elevated.
In particular, the Nifty Alpha 50 and Nifty Next 50 have delivered outstanding performances, each realizing over 40% returns as of October 15. Meanwhile, the Nifty Smallcap 250 index has also shown strength, climbing 31% during the same period.
Is the Rally Sustainable?
However, signs of caution are beginning to emerge among investors. At Definedge, we have introduced a unique analytical tool called the DeMAP (Definedge Momentum & Performance Chart), which assesses momentum and performance across different stocks and sectors. Currently, the DeMAP chart is signaling potential risks, suggesting that bullish investors should proceed with caution.
This shift in sentiment highlights the need for vigilance as the market progresses. Investors should consider reviewing their strategies and remain mindful of any red flags that may indicate a change in market direction.
Warning Signals on the Horizon

DeMAP
Understanding DeMAP
Definedge Momentum and Performance (DeMAP) is an extensive analytical instrument crafted by Definedge to enable traders to quickly evaluate market dynamics. This tool amalgamates various essential studies, incorporating price evaluations, momentum indicators, relative strength metrics, along with diverse charting methodologies such as Point and Figure, Renko, and candlestick analysis. The DeMAP framework is segmented into two key components: Sky and Water. Stocks positioned above the zero line within Sky are denoted as stars, indicating robust bullish momentum, while those lying below the zero line in Water are represented as circles, signifying bearish trends.
Upon reviewing the DeMAP chart, a troubling trend becomes apparent: the slope of major sectors continues to trend downward. This downturn is evident across broader market indices, specifically the Nifty500 and Nifty Midcap 150.
Concerns on the Smallcap Front
Particularly alarming is the decline of the Nifty Smallcap 100, which has recently fallen into negative territory. This development hints at profit-taking activities and distribution—a common precursor to impending market adjustments.
In technical analysis terms, when momentum begins to diminish, coupled with the emergence of distribution patterns, it frequently foreshadows a shift from buyers to sellers. This transition can ignite a more extensive market sell-off. The warning indicators present in the current market landscape suggest the possibility of more significant market pullbacks in the near future.
Bridging the Analysis
Traders and investors alike should remain vigilant as these signs unfold. Awareness of tools like DeMAP can be invaluable for making informed decisions amidst evolving market conditions. Understanding the implications of these trends could aid in strategizing to mitigate potential losses or capitalize on emerging opportunities.
Market Watch: Increasing Apprehension Amid Broader Sell-Off
Expanding Caution Signals
In recent weeks, a palpable sense of caution has enveloped the market landscape. Notably, foreign institutional investors (FIIs) have been actively selling their stakes since the onset of October, resulting in a substantial net outflow of ₹63,874 crore. This ongoing wave of selling has contributed to a tangible downward trend across the broader market spectrum.
Domestic Resilience and Retail Investor Dilemmas
On the domestic front, institutional investors (DIIs) have countered this trend, engaging in a net buying surge amounting to ₹61,725 crore in cash. However, a pressing question looms: How resilient will retail investors remain under this strain?
The real crux of the issue lies in the response of retail investors, especially those holding mutual fund investments. Will the prevailing uncertainty lead them to panic and hit the exit button?
The Sentiment Shift: From Greed to Fear
Historically, market dynamics have shown that sentiment can shift rapidly under the influence of fear. Currently, the mood at Dalal Street has transitioned away from greed, although fear has not yet dominated the scene. Should fear take root, it could set the stage for another correction, potentially pulling the Nifty50 down, triggering profit-taking in the Nifty Next 50, and ultimately cascading into the larger markets.
The Fragility of Market Sentiment
The fragility of market sentiment is undeniable. Following an extended bull run, many investors find themselves increasingly cautious. The shift from a mindset of greed to one of fear is often gradual but can become abrupt and severe. If retail investors start to exit the market en masse, it could worsen any corrections, particularly affecting small- and mid-cap stocks.
Moreover, mutual funds, which have historically served as a cornerstone for retail investment, may experience significant outflows. Such a trend could further amplify the pressure on an already sensitive market.
The Nifty500 at a Crossroads: Navigating the Bulls and Bears
The Nifty500 serves as a comprehensive market index that encapsulates an extensive array of stocks, spanning large-, mid-, and small-cap categories. Its diverse representation makes this index an essential tool for gauging the overall sentiment and performance of the market.
Nifty500 weekly chart
Weekly Chart Analysis
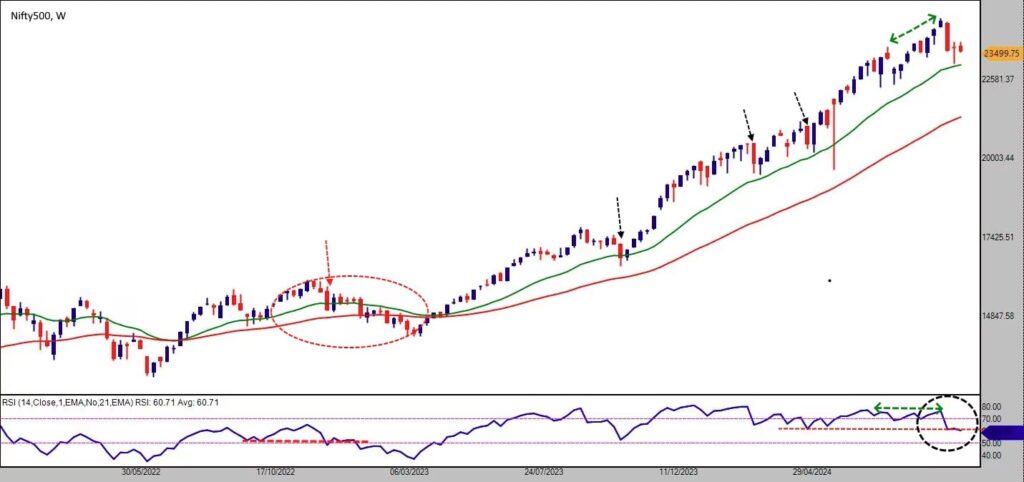
Examining the weekly chart reveals a distinct pattern characterized by higher highs and higher lows. This formation aligns with bullish principles as per Dow Theory, suggesting a positive market outlook. The index is currently trading above both the 20-week exponential moving average (20WEMA) and the 50-week exponential moving average (50WEMA). This positioning reflects robust momentum in both the short and medium-term horizons.
Underlying Concerns
While the bullish indicators are promising, there are underlying factors that warrant caution, especially when considering the relative strength index (RSI). The RSI acts as a momentum oscillator and often foreshadows shifts in market dynamics. The current chart analysis shows the RSI has dipped below its prior low of 62, which raises significant concerns. This decline suggests a potential weakening in momentum, despite the ongoing upward movement in price.
Divergence and Historical Precedents
What truly raises concern is the noticeable divergence among market indicators, along with the apprehension of past patterns repeating themselves. When the Nifty500 reached its peak of 24,573 (marked by a green arrow on the chart), the RSI did not echo this new peak. Such a discrepancy signals a traditional bearish divergence, indicating that the strength propelling the rally might be diminishing. The subsequent fall of the RSI below its previous low of 62 further amplifies the fears that the bullish movement could be losing momentum.
Historical Patterns and Current Market Sentiment
Historically, the recent trend has signaled potential challenges for the index. A notable instance occurred in 2023, where the index breached its previous Relative Strength Index (RSI) low, leading to a decline below its 50-Week Exponential Moving Average (50WEMA), which currently registers at 21,265.
Signs of Hope for the Bulls
Despite the bearish undertones, there is still a glimmer of hope for bullish investors. A significant indicator is the Doji candlestick pattern that emerged last week. Doji patterns are indicative of market indecision and may often precede a trend reversal, contingent on the price movement that follows. Two critical levels to monitor are the low of this Doji at 23,089 and the 20-Week Exponential Moving Average (20WEMA) around 23,007. For the bulls to maintain their positions and reignite upward momentum, it is essential for the Nifty500 to remain above these benchmark levels.
Caution Amidst Optimism
While the descending trend in the DeMAP highlights areas of concern, the market on D-Street will require robust inflows as well as several positive developments to uplift investor sentiment and rebuild confidence.
As we look to the future, there is hope for an upward trajectory in the market, potentially leading to a more prosperous Diwali. Nevertheless, it is wise to be prepared for any outcomes that may arise. While an enduring bull market is desirable, the reality is that the market has its unique rhythm; our role is to adapt to its movements rather than resist them.
Important Disclaimer
It is essential to note that the intention of this article is solely to present intriguing charts, data points, and thought-provoking insights. This content is not intended as a financial recommendation. Before making any investment decisions, consulting with a financial advisor is strongly advised. The information provided is strictly for educational purposes.
Disclosure Statement
In accordance with Sebi guidelines, the writer and associated parties may or may not hold positions in the stocks, commodities, cryptocurrencies, or other assets discussed within this article.