The Index of Industrial Production (IIP) may appear outdated, but leveraging GST data can lead to the development of a more comprehensive economic indicator.
Is the Index of Industrial Production (IIP) Losing Its Relevance in Today’s Economy?
Valid Criticisms
Recent criticism of the Index of Industrial Production (IIP) has called into question its relevance as a leading indicator of economic growth. The observations made in a Mint op-ed titled ‘India’s IIP is losing its relevance as a lead indicator of economic growth’ highlight this concern. The concerns raised are legitimate, and it is important to understand the reasons behind this dissatisfaction by examining the construction of the series.
Historical Significance
The IIP holds the distinction of being one of the oldest statistical products generated by the National Statistical Office, with roots that can be traced back to the pre-independence era. The data used to calculate the index is collected from numerous source agencies, many of which have their origins in the administrative machinery developed during the 1950s ‘command economy.’ Over time, several of these agencies have lost their relevance. For some, providing data for the IIP appears to be their sole purpose for continued existence.
Inconsistencies in Growth
One of the key issues raised in the referenced article is that the growth reflected in the IIP does not align with India’s actual GDP growth. This discrepancy is not unique to the current IIP series; it has been an ongoing concern during the last three revisions of the series. During each revision, there has been a period of overlap, during which the growth indicated by the new series tends to surpass that of the old series. The only exception to this trend is the two years following the 2008 financial crisis.
Assessing Relevance and Reliability
The criticisms directed at the IIP underscore the need for a comprehensive review of its relevance and reliability in the context of today’s economy. By delving into the historical underpinnings of the IIP and the manner in which data is collected, it becomes evident that the current framework may not adequately capture the dynamics of the contemporary industrial landscape.
Analysis of IIP’s Growth Performance
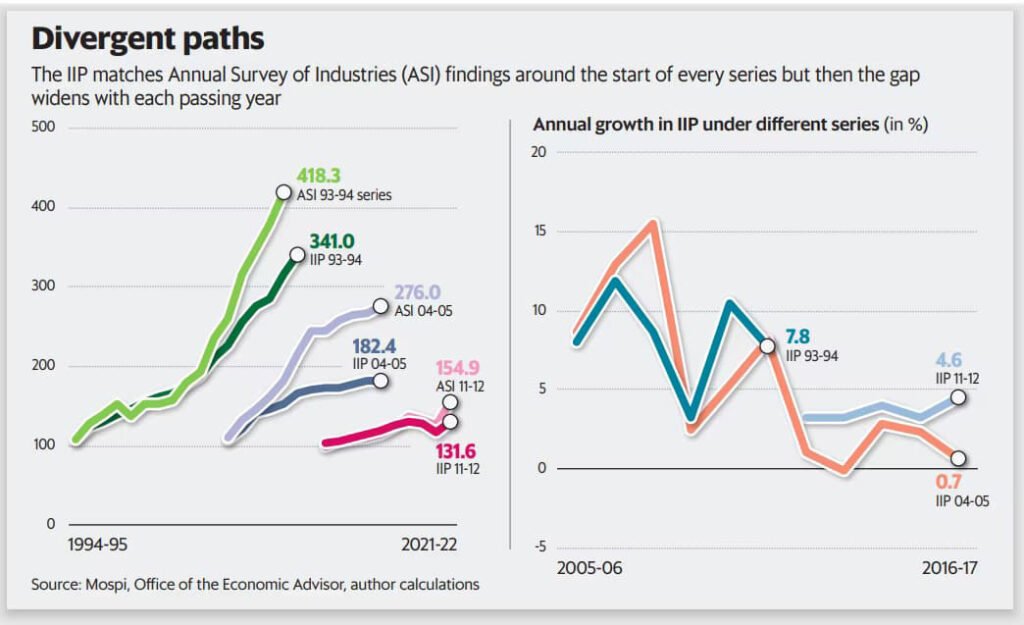
To analyze the dampened growth performance of the Index of Industrial Production (IIP), we can compare it with the Annual Survey of Industries (ASI). The accompanying graph utilizes data from three IIP series’ (base years 1993-94, 2004-05, and 2011-12) and compares them to the ASI. This comparison involves taking the output value from the ASI, adjusting it to constant prices using the wholesale price index, and expressing it as an index for the comparable IIP base years. Upon examination, we notice a significant divergence between IIP and ASI after a few years.
Implications of Divergence
The divergence between IIP and ASI has implications for the estimation of value-added in the quasi corporate and household segments of the economy. Early estimates of GDP tend to underestimate the economic contributions of these segments due to the divergence.
Construction of IIP and Inherent Issues
The construction of the IIP for the manufacturing segment contributes to the observed divergence. The identification of establishments and the collection of monthly production data for specific items are frozen based on their importance in the base year manufacturing profile. This approach presents inherent problems as it fails to capture new establishments and leads to non-responses from closed establishments. Notably, the non-response rate in the manufacturing segment significantly affects the total IIP.
Challenges in Data Collection
As noted in the January 2024 IIP press release, the final revised estimates for August 2023 had a weighted response rate of 95%. This indicates that non-responses, concentrated in the manufacturing segment, pose a considerable challenge. In comparison, ASI data reveals an increase in the number of factories, indicating that the IIP fails to capture changes in the item mix and excludes newer factories from its data collection.
Tracking Performance
Despite these challenges, the graph illustrates that the IIP manages to track ASI reasonably well in years close to the base year. However, the divergence becomes more pronounced over time, indicating the limitations in IIP’s ability to reflect the true industrial production scenario.
Analyzing the Divergence Between IIP and ASI Data
The divergence between the Index of Industrial Production (IIP) and the Annual Survey of Industries (ASI) poses significant implications for the accuracy of GDP estimates, particularly in gauging value-added in the quasi corporate and household segments. One contributing factor to this disparity is the substantial time gap for IIP revisions due to the process involved in releasing ASI data, which has only been gradually reducing over the years. Moreover, establishing protocols for collecting monthly data through multiple source agencies entails bureaucratic hurdles, leading to a time-consuming process. Consequently, each revision takes at least 5-6 years, and non-responses become evident only after the series is launched, posing challenges in capturing establishments that close during the revision period.
The Need for High-Frequency Manufacturing Output Indicators
There is a palpable demand for an accurate high-frequency indicator of manufacturing output, as current reliance on indicators such as the Purchasing Managers Index (PMI) falls short of providing a comprehensive reflection of output. In this context, the Goods and Services Tax (GST) system emerges as a promising source of high-frequency economic information, enabling the construction of an indicator far superior to the existing IIP. With virtually all manufacturing establishments filing monthly returns to obtain input tax credit, the GST system offers detailed information on both output and value added by the HSN code. This wealth of data presents the opportunity to devise mechanisms for extracting accurate and timely indicators of production and value added, surpassing the capabilities of the IIP.
Leveraging GST Data for Enhanced Economic Insights
By harnessing GST data for statistical purposes, it is feasible to gain a deeper and faster understanding of economic changes in India. This would empower policymakers to intervene more effectively, armed with richer and more timely economic insights. Furthermore, similar to the monthly merchandise trade data released by the department of commerce, it is viable to conduct this statistical exercise without compromising commercial confidentiality, thereby maximizing the utility of GST data for economic analysis and policy formulation.
In conclusion, the utilization of GST data to develop robust high-frequency indicators presents an opportunity to address the limitations of existing metrics such as the IIP. By leveraging the wealth of information provided by the GST system, policymakers and analysts can gain a more accurate and timely understanding of manufacturing output, fostering more informed and effective intervention strategies for India’s economy.