For the Indian economy to be effectively monitored, an updated value-based measure is crucial for the Index of Industrial Production.
High-Frequency Indicators: A New Era of Economic Monitoring
When it comes to assessing growth, traditional measures like gross domestic product (GDP) have long been the go-to for policymakers, economists, and markets. However, in today’s world of abundant information, high-frequency indicators are taking the spotlight, offering early insights into evolving economic landscapes and empowering agile policymaking.
In India, the array of high-frequency data has expanded in recent years. However, the original activity gauge, the monthly index of industrial production (IIP), which has been historically viewed as a “leading” indicator of the economy, is gradually losing its significance. IIP readings are increasingly diverging from GDP trends and often yielding contradictory results when compared with other macro data such as external trade numbers, the annual survey of industries (ASI), and company performance reports.
Between fiscal years 2011-12 and 2022-23, India’s real GDP has exhibited a compound annual growth rate (CAGR) of 5.7%, whereas the IIP has only grown at a rate of 3% per annum, according to official figures. This divergence is more pronounced in absolute terms: as of 2022-23, the actual size of real GDP is 83% larger than the base year of 2011-12, while the IIP has only seen a 37% increase. Delving deeper into the data, it becomes evident that while output in the power and mining sectors can be quantified by metrics such as electricity generation or coal production, measuring manufacturing output solely based on volume of goods produced is inadequate.
The discrepancy between headline IIP and GDP becomes even more evident when focusing on manufacturing. Over the past decade, there has been a nearly 3 percentage point gap between manufacturing GDP growth and the corresponding industrial production measure. This rift underscores the need to rethink the relevance of traditional indicators in an evolving economic landscape and highlights the complexities involved in capturing the nuances of modern economic activity.
Understanding the Discrepancy in Investment Activity
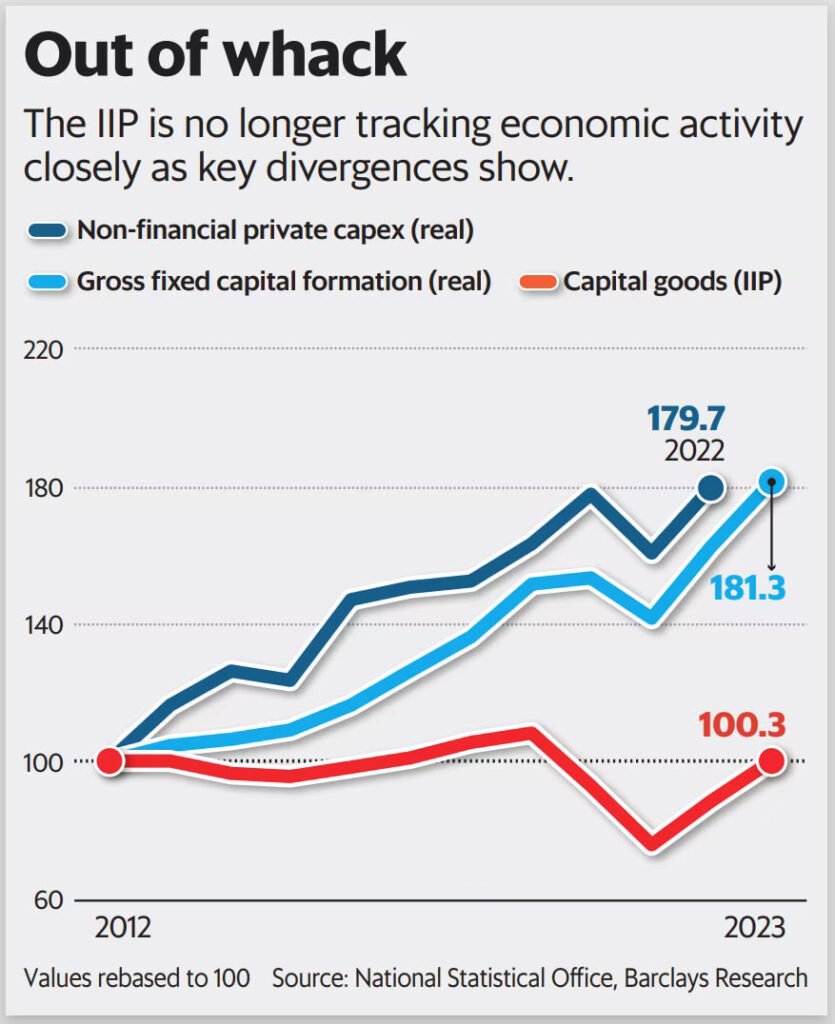
The discrepancy between investment activity as reflected in the industrial production (IP) and gross fixed capital formation (GFCF) data has caught the attention of financial analysts. While GFCF has shown consistent annual growth at 5.6%, the capital goods industrial production (IP) has remained relatively flat with only a 0.03% compound annual growth rate over the last decade. This reflects a significant disparity, especially when compared to other investment-related indicators and indices showing a clear upward trend, particularly post-pandemic.
Methodology Variance between IIP and GDP Estimation
A key factor contributing to this disparity lies in the difference in the methodology and construction of the Index of Industrial Production (IIP) and the estimation of Gross Domestic Product (GDP). The IIP primarily serves as a volume measure of production, where the number of manufactured goods within various sectors is counted and compared to a base year. However, less than 20% of the IIP takes into account the value of goods produced, leading to an inherent limitation in its representation of economic activity.
On the other hand, GDP serves as a value-added measure, considering the value of final output produced in both nominal and real terms. This contrast in measurement methodologies contributes to a divergence in the depiction of investment trends between the IIP and GFCF.
Lack of Consideration for Technological Advancements and Shifts in Production
Another critical issue with the current IIP series is its inability to account for improvements in capacity and technological changes. The weights of the IIP index have remained fixed since the base year of 2011-12, thereby failing to incorporate the production of newer goods, such as smartphones, which have become increasingly prominent in India.
For instance, trade data from the Union Ministry of Trade and Commerce indicates a substantial growth in the exports of ‘telecom instruments,’ doubling from $4.8 billion in 2019-20 to $12 billion in 2022-23. However, the IIP data for ‘mobile and telecom instruments’ suggests a 3.2% average shrinkage in this sector during the same period. This discrepancy underscores the incompleteness of the IIP representation, particularly in reflecting the growth dynamics of evolving industries and capabilities in the country’s manufacturing sector.
Skewed Representation and Potential Bias
With its current weightings, the IIP appears to be skewed more towards auto and auto components, leading to imbalances in the representation of industrial production. The apparent synchronization between trends in auto production and capital goods IP further accentuates potential biases within the index, hinting at the need for comprehensive reassessment and potential recalibration to capture the broader industrial landscape accurately.
Discrepancy in Industrial Production Measurement
Analysts have raised concerns about the discrepancy and representativeness of India’s Index of Industrial Production (IIP). A study by M.C. Singhi highlighted the limitations of the fixed weights system of the IIP, showing that it does not readily accommodate new items and indicating the need for a more current base year. Additionally, the National Institute of Public Finance and Policy expressed difficulties in accurately interpreting changes in production with the IIP, raising questions about its reliability.
Importance for Economic Analysis
The IIP data is integral to the quarterly estimations of GDP, and its accuracy is crucial for informed policy decisions. However, the study findings revealed a downward bias in the IIP data, suggesting the need for a more updated and value-based measure of industrial production to ensure its relevance as a leading indicator of the economy’s trajectory.
Need for Validation and Improvement
To validate the accuracy of the IIP, it is essential to periodically reconcile its data with the more comprehensive Annual Survey of Industries (ASI) information. While ASI data is typically available with a lag of 2-3 years, leveraging other industrial activity indicators, such as retail sales, to provide more frequent validation of the IIP’s accuracy would be beneficial.
Ensuring Policy Relevance
Accurate quarterly GDP assessments are essential for effective policy analysis and decision-making. Therefore, a reevaluation and modernization of the IIP are long overdue to ensure that it continues to serve as a reliable and relevant source of information for economic analysis.
The article underscores the need for improving the IIP to better align with the evolving industrial landscape and to ensure that it accurately reflects the country’s economic activity. By addressing the limitations and discrepancies within the current measurement methodology, policymakers and analysts can make more informed decisions based on a more reliable and representative measure of industrial production.